Measurement
Part of Measuring a creator studio without rewarding shortcuts
A controlled studio dashboard with versioned queries and visible gaps
Build a controlled studio dashboard with fixed definitions, versioned queries, visible missing data, evidence links and cautious interpretation.
A creator studio equipment reporting dashboard needs a question, a controlled dataset and an action route. Start with the decisions an England studio must make this period, then expose the records behind each number. Do not begin with a chart type or software shortlist.
This is a desk-built method. It has not been connected to an analytics account, asset register or production log.
What to take away
- Start with the decisions an England studio must make, not a chart type or software shortlist.
- Store event, population, numerator, denominator, unit, inclusion and exclusion rules for every measure.
- Give every card an evidence label and never combine output, observation, attribution and causal estimates in one total.
- A causal label needs a pre-specified question, credible comparison and qualified evaluation review.
- A second competent person rebuilds the material cards from frozen inputs before circulation.
Set up the reporting contract
Write the reporting period, timezone, England location rule, eligible workflow, asset classes and intended users at the top. For every measure, store its event, population, numerator, denominator, unit, inclusion and exclusion rules, source systems, collection date, query version, owner, uncertainty and update trigger.
Reporting contract fields
- Reporting period and timezone
- England location rule
- Eligible workflow and asset classes
- Event, population, numerator, denominator
- Inclusion and exclusion rules
- Source systems and collection date
- Query version, owner, uncertainty, update trigger
The government's data quality framework separates completeness, uniqueness, consistency, timeliness, validity and accuracy. Put those checks beside the result. A green completeness mark must not conceal duplicate jobs or stale asset states.
Create a small data dictionary containing the field name, plain-English meaning, allowed value, source, owner and effective date. Reject an unexpected value into a visible queue. Do not force it into the nearest category simply to finish the refresh.
Build four connected views
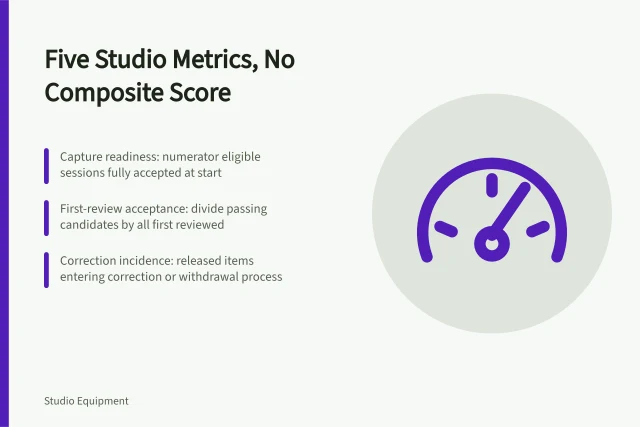
The operations view shows eligible sessions, held work, first-review decisions, corrections and restore exercises. The equipment view shows exact asset identity, approved configuration, inspection status and withdrawal state. The release view reconciles master, caption, transcript, disclosure and rights versions. The decision view records what an owner did because of the evidence and when that decision will be reviewed.
Join records through controlled identifiers rather than titles or filenames. Keep rejected rows and unmatched joins in an exceptions table. The Government Analysis Function's RAP strategy advocates coded analysis, version control and managed dependencies. A private dashboard does not become an official statistic by following those practices.
Label what the number means
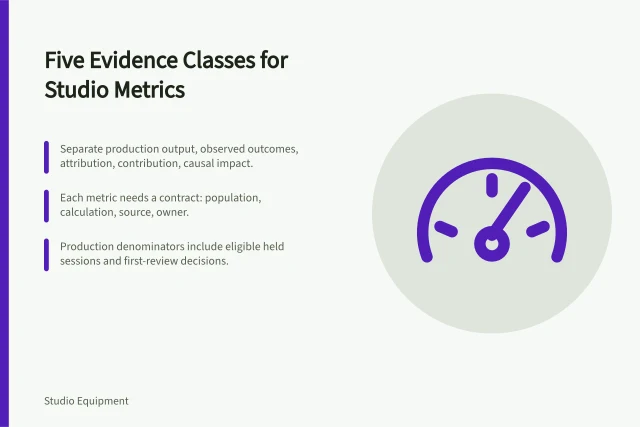
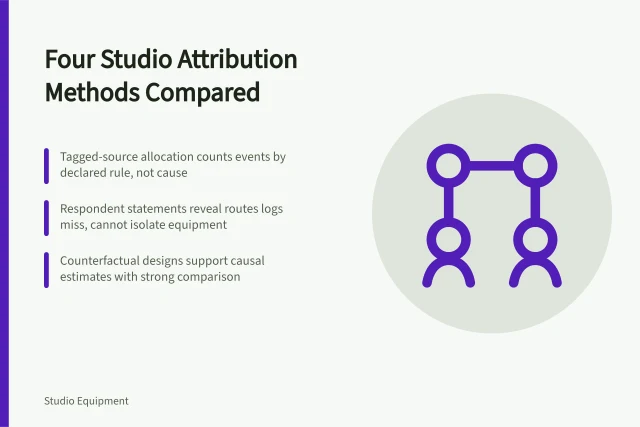
Give every card an evidence label: production output, observed downstream event, attribution, contribution assessment or causal estimate. Never combine them in one total. A release count is an output. A visit recorded after a tagged link is an observation with an allocation rule. Neither demonstrates that equipment caused a commercial result.
HM Treasury's QPIE guidance explains that monitoring can show change without showing that an intervention caused it. Any causal label therefore needs a pre-specified question, credible comparison and qualified evaluation review.
Protect people and the audit trail
Use job and asset identifiers where personal identity is unnecessary. The ICO's data-minimisation guidance requires personal data to be adequate, relevant and limited to the stated purpose. Tracking technologies need a separate privacy and PECR decision before collection.
Restrict raw rows, log access and protect the approved reporting snapshot. Show suppression, corrections, late data and series breaks. Do not overwrite a previous definition to make the line appear continuous.
Close with an action log
For each exception or threshold crossing, name the decision owner, evidence reviewed, action, deadline and condition for reopening the workflow. If a source changes, pause comparison and issue a new metric version. The dashboard is useful when a reviewer can trace a displayed value to its records and see what happened next.
Before circulation, a second competent person rebuilds the material cards from the frozen inputs. Record differences and corrections. Export an accessible reporting version with explanatory text rather than relying on colour, hover states or a chart alone. Archive the approved snapshot, dictionary, query, exception table and action log under one reporting identifier.
Before you act
- Write the reporting period, timezone and England location rule at the top.
- Store query version, owner, uncertainty and update trigger for every measure.
- Join records through controlled identifiers, not titles or filenames.
- Keep rejected rows and unmatched joins in an exceptions table.
- Log access and protect the approved reporting snapshot.
- Name the decision owner, action and deadline for each exception.
Common questions
What should a reporting contract record for every measure?
It should store the event, population, numerator, denominator, unit, inclusion and exclusion rules, source systems, collection date, query version, owner, uncertainty and update trigger. The reporting period, timezone, England location rule, eligible workflow, asset classes and intended users go at the top.
Why must output and causal estimates stay separate on a dashboard?
A release count is an output, while a visit after a tagged link is an observation with an allocation rule. Neither shows that equipment caused a commercial result. HM Treasury's QPIE guidance explains that monitoring can show change without showing that an intervention caused it.
What happens when a source system changes?
Pause comparison and issue a new metric version. Do not overwrite a previous definition to make the line appear continuous. Show suppression, corrections, late data and series breaks, and archive the approved snapshot, dictionary, query, exception table and action log under one reporting identifier.